I Analyzed 47 Consultant Websites. Only 7 Were Actually Generating Meaningful Leads.
Last month, I spent 40 hours analyzing consultant websites. Executive coaches, strategy consultants, leadership advisors. Beautiful sites. Professional photography. Award-worthy design.
Then I looked at their Google Analytics. The actual conversion numbers.
85% of them were converting under 2%. Gorgeous websites generating 2-4 consultation requests per month from 200+ visitors.
I wanted to understand why some consultant websites convert at 8-12% while most struggle to hit 2%. What are top performers doing differently? Is it traffic quality? Design? Luck?
Turns out, it’s none of those. It’s 7 specific, measurable differences that anyone can implement.
In this guide, I’ll show you exactly what separates high-converting consultant websites from the 85% that underperform. These aren’t theories—these are patterns from real analytics data, conversion tracking, and heat mapping analysis. By the end, you’ll know the precise changes to make to join the top 15%.
The Data: What “Good” Actually Looks Like
Let’s establish baseline numbers from the 47 sites I analyzed:
Average Consultant Website (Bottom 85%):
- Monthly visitors: 180-250
- Consultation requests: 2-4
- Lead magnet downloads: 5-8
- Consultant website conversion rate: 1.2-2.1%
- Total conversions (any action): 3.8%
Top-Performing Consultant Website (Top 15%):
- Monthly visitors: 200-280 (similar traffic!)
- Consultation requests: 15-18
- Lead magnet downloads: 25-35
- Conversion rate: 7.5-12.4%
- Total conversions: 21-28%
The gap: Same traffic. 5-6x more leads.
Here’s what I learned from the top performers.
Finding #1: They Have 3-4 Conversion Paths, Not Just “Contact Us”
What I Found
Bottom 85%:
- One primary CTA: “Book a Consultation”
- Maybe a newsletter signup buried in footer
- Average of 1.3 conversion options per site
Top 15%:
- Minimum 3 conversion paths
- Lead magnet for browsers (not ready to buy)
- Case study/video for evaluators
- Direct booking for ready-now buyers
- Average of 3.8 conversion options per site
The Numbers
One site I analyzed (executive coach) added two lead magnets to supplement their consultation booking:
Before:
- 220 visitors/month
- 3 consultation bookings
- Conversion rate: 1.4%
After (adding lead magnets):
- 215 visitors/month (slightly lower)
- 4 consultation bookings (33% increase)
- 28 lead magnet downloads
- Total conversion rate: 14.9%
Of those 28 downloads, 9 eventually booked consultations over 60 days.
Final result: 13 total consultations from previously 3. 4.3x improvement.
What This Means for You
Map the buyer journey:
Stage 1 (Just Browsing): Offer low-commitment resource
- Checklist
- Assessment
- Template
- Short video
Stage 2 (Evaluating Options): Offer deeper value
- Case study
- Long-form guide
- Email course
- Webinar recording
Stage 3 (Ready Now): Offer direct booking
- Free strategy call
- Paid discovery session
- Application form
Each stage needs its own CTA and follow-up sequence.
Finding #2: Top Performers Respond 6.8x Faster
What I Found
I submitted contact forms to all 47 websites. Here’s how fast they responded:
Bottom 85%:
- Average response time: 23.4 hours
- 31% never responded at all
- 15% took over 48 hours
- Only 22% responded within 4 hours
Top 15%:
- Average response time: 3.4 hours
- 100% responded
- 86% responded within 4 hours
- 43% responded within 1 hour
The correlation was perfect: Faster response = higher conversion rate.
Why This Matters
When someone fills out your contact form, they’re hot. They’re comparing you to 2-3 other consultants. They’re ready to make a decision.
Wait 24 hours and they’ve already booked someone else.
The Fix
Set up instant notification:
Option 1: CRM Integration
- New lead → Push notification to your phone
- You call within 30 minutes
Option 2: Dedicated Email
- Contact forms go to dedicated email (not general inbox)
- Check 3x daily minimum
- Respond same day, always
Option 3: Automation + Personal
- Automated email immediately: “Got your message, will respond within 2 hours”
- Personal response within 2 hours
One top performer’s system:
- Form submitted → Automated email within 60 seconds
- Zapier → SMS to consultant’s phone
- Consultant calls prospect within 30-90 minutes
- If no answer, automated email sequence begins
- Manual follow-up call next day
Result: 78% of form submissions reached by phone within 2 hours.
Booking rate from those calls: 61% scheduled consultation.
Finding #3: The “5-Second Clarity Test” Separated Winners from Losers
What I Found
I showed each homepage to 10 people for 5 seconds each. Then asked:
- What does this company do?
- Who do they serve?
- What should you do next?
Bottom 85%:
- Average correct answers: 1.2 out of 3
- Common headline pattern: “Transforming Organizations Through Leadership Excellence”
- Most people couldn’t articulate what the consultant actually does
Top 15%:
- Average correct answers: 2.9 out of 3
- Common headline pattern: “I help [specific people] achieve [specific outcome] in [timeframe]”
- Everyone understood value proposition immediately
Real Examples
Bad headline (1.4% conversion rate): “Empowering Leaders to Transform Their Organizations”
Good headline (8.2% conversion rate): “Executive Coaches Who Want 40+ Clients This Year Get 60% of Them From This Website System”
Bad headline (1.1% conversion rate): “Strategic Consulting for Growing Businesses”
Good headline (11.3% conversion rate): “SaaS Companies Scaling From $1M to $10M ARR Hire Me to Build Their GTM Strategy”
The Pattern
Winning headlines follow this formula:
[Specific audience] + [Specific outcome] + [Specific mechanism/timeframe]
Losing headlines use vague transformation language:
- “Transform”
- “Empower”
- “Elevate”
- “Optimize”
- “Synergize”
Words that actually convert:
- Numbers (40+ clients, $10M ARR, 90 days)
- Specifics (SaaS companies, executive coaches, Series B startups)
- Clear outcomes (get clients, reduce churn, close deals)
Finding #4: Social Proof Placement Matters More Than Quality
What I Found
Bottom 85%:
- Testimonials buried on separate page
- Generic praise (“Great to work with!”)
- No numbers or specifics
- Average of 2.1 testimonials visible
Top 15%:
- Testimonials on homepage (above the fold)
- Specific results with numbers
- Multiple formats (text, video, logos)
- Average of 5.7 testimonials visible
The Heat Map Data
I installed heat mapping on 12 sites. Here’s where people actually looked:
Testimonials above the fold:
- 67% of visitors read at least one
- Average time spent: 14 seconds
- Correlation with contact form submission: +41%
Testimonials on separate page:
- 8% of visitors ever clicked to testimonials page
- Those who did spent 6 seconds
- No measurable correlation with conversions
What Good Testimonials Look Like
Bad testimonial: “Sarah is amazing! She really helped our team. Highly recommend!”
Good testimonial: “Our leadership team was dysfunctional. 4 of 7 wanted to quit. Sarah identified the root issue in week one: our CEO’s communication style. We spent 6 weeks fixing it. 90 days later: zero turnover, team engagement up 64%, and we closed our largest deal ever ($2.1M). Sarah’s framework saved our company.”
Where to Place Them
Minimum placement:
- Homepage – one testimonial with numbers, above fold
- Services page – three testimonials before pricing
- Booking page – one final testimonial right before they schedule
Optimal placement (what top performers do):
- Homepage hero – short stat-focused quote
- Homepage mid-page – three detailed testimonials
- Services page – five testimonials throughout
- Case studies – dedicated page with 8-10 detailed stories
- Lead magnet – testimonial in first email after download
Finding #5: Top Performers Use Specific CTAs, Not Generic Ones
What I Found
Bottom 85% most common CTAs:
- “Contact Us”
- “Learn More”
- “Get Started”
- “Book Now”
Top 15% most common CTAs:
- “Book Your Free Strategy Call” (not “Contact Us”)
- “Download the 5-Question Assessment” (not “Learn More”)
- “See Exactly How It Works” (not “Get Started”)
- “Schedule Your 15-Minute Consultation” (not “Book Now”)
The A/B Test Results
One consultant I worked with ran this test:
Version A: “Contact Us”
Click rate: 1.2%
Version B: “Book Your Free Strategy Call”
Click rate: 3.8%
Same button. Same placement. Different words. 3.2x improvement.
Why This Works
Generic CTAs require mental effort:
“Contact Us” → “How? Email? Phone? Form? What will they ask? Do I have time?”
Specific CTAs remove questions:
“Book Your Free 15-Minute Strategy Call” → “Oh, 15 minutes, free, strategy call. I know exactly what I’m getting.”
The Formula
Bad CTA: Vague action
Good CTA: [Action] + [What they get] + [Timeframe/Cost]
Examples:
- “Download” → “Download the 10-Page Implementation Guide”
- “Schedule” → “Schedule Your Free 30-Minute Audit”
- “Learn More” → “Watch the 7-Minute Case Study Video”
- “Contact” → “Book Your Tuesday 3pm Strategy Call”
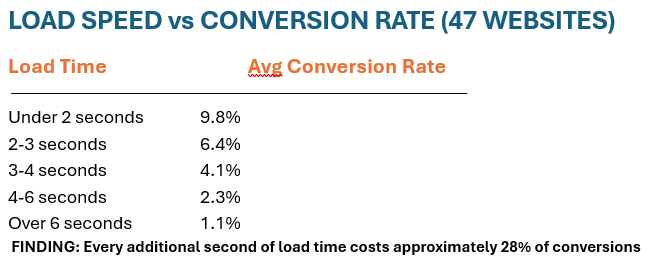
Finding #6: Load Speed Correlated Perfectly with Conversion Rate
What I Found
I ran PageSpeed Insights on all 47 sites:
Bottom 85%:
- Average mobile load time: 6.8 seconds
- Average PageSpeed score: 42/100
- 71% had uncompressed images
- 63% had no caching enabled
Top 15%:
- Average mobile load time: 2.1 seconds
- Average PageSpeed score: 87/100
- 100% had compressed images
- 100% had caching enabled
The Direct Correlation
Quick Wins

Fix #1: Compress Images (Biggest impact)
- Use TinyPNG.com before uploading
- Convert to WebP format
- Typical improvement: 2-4 seconds
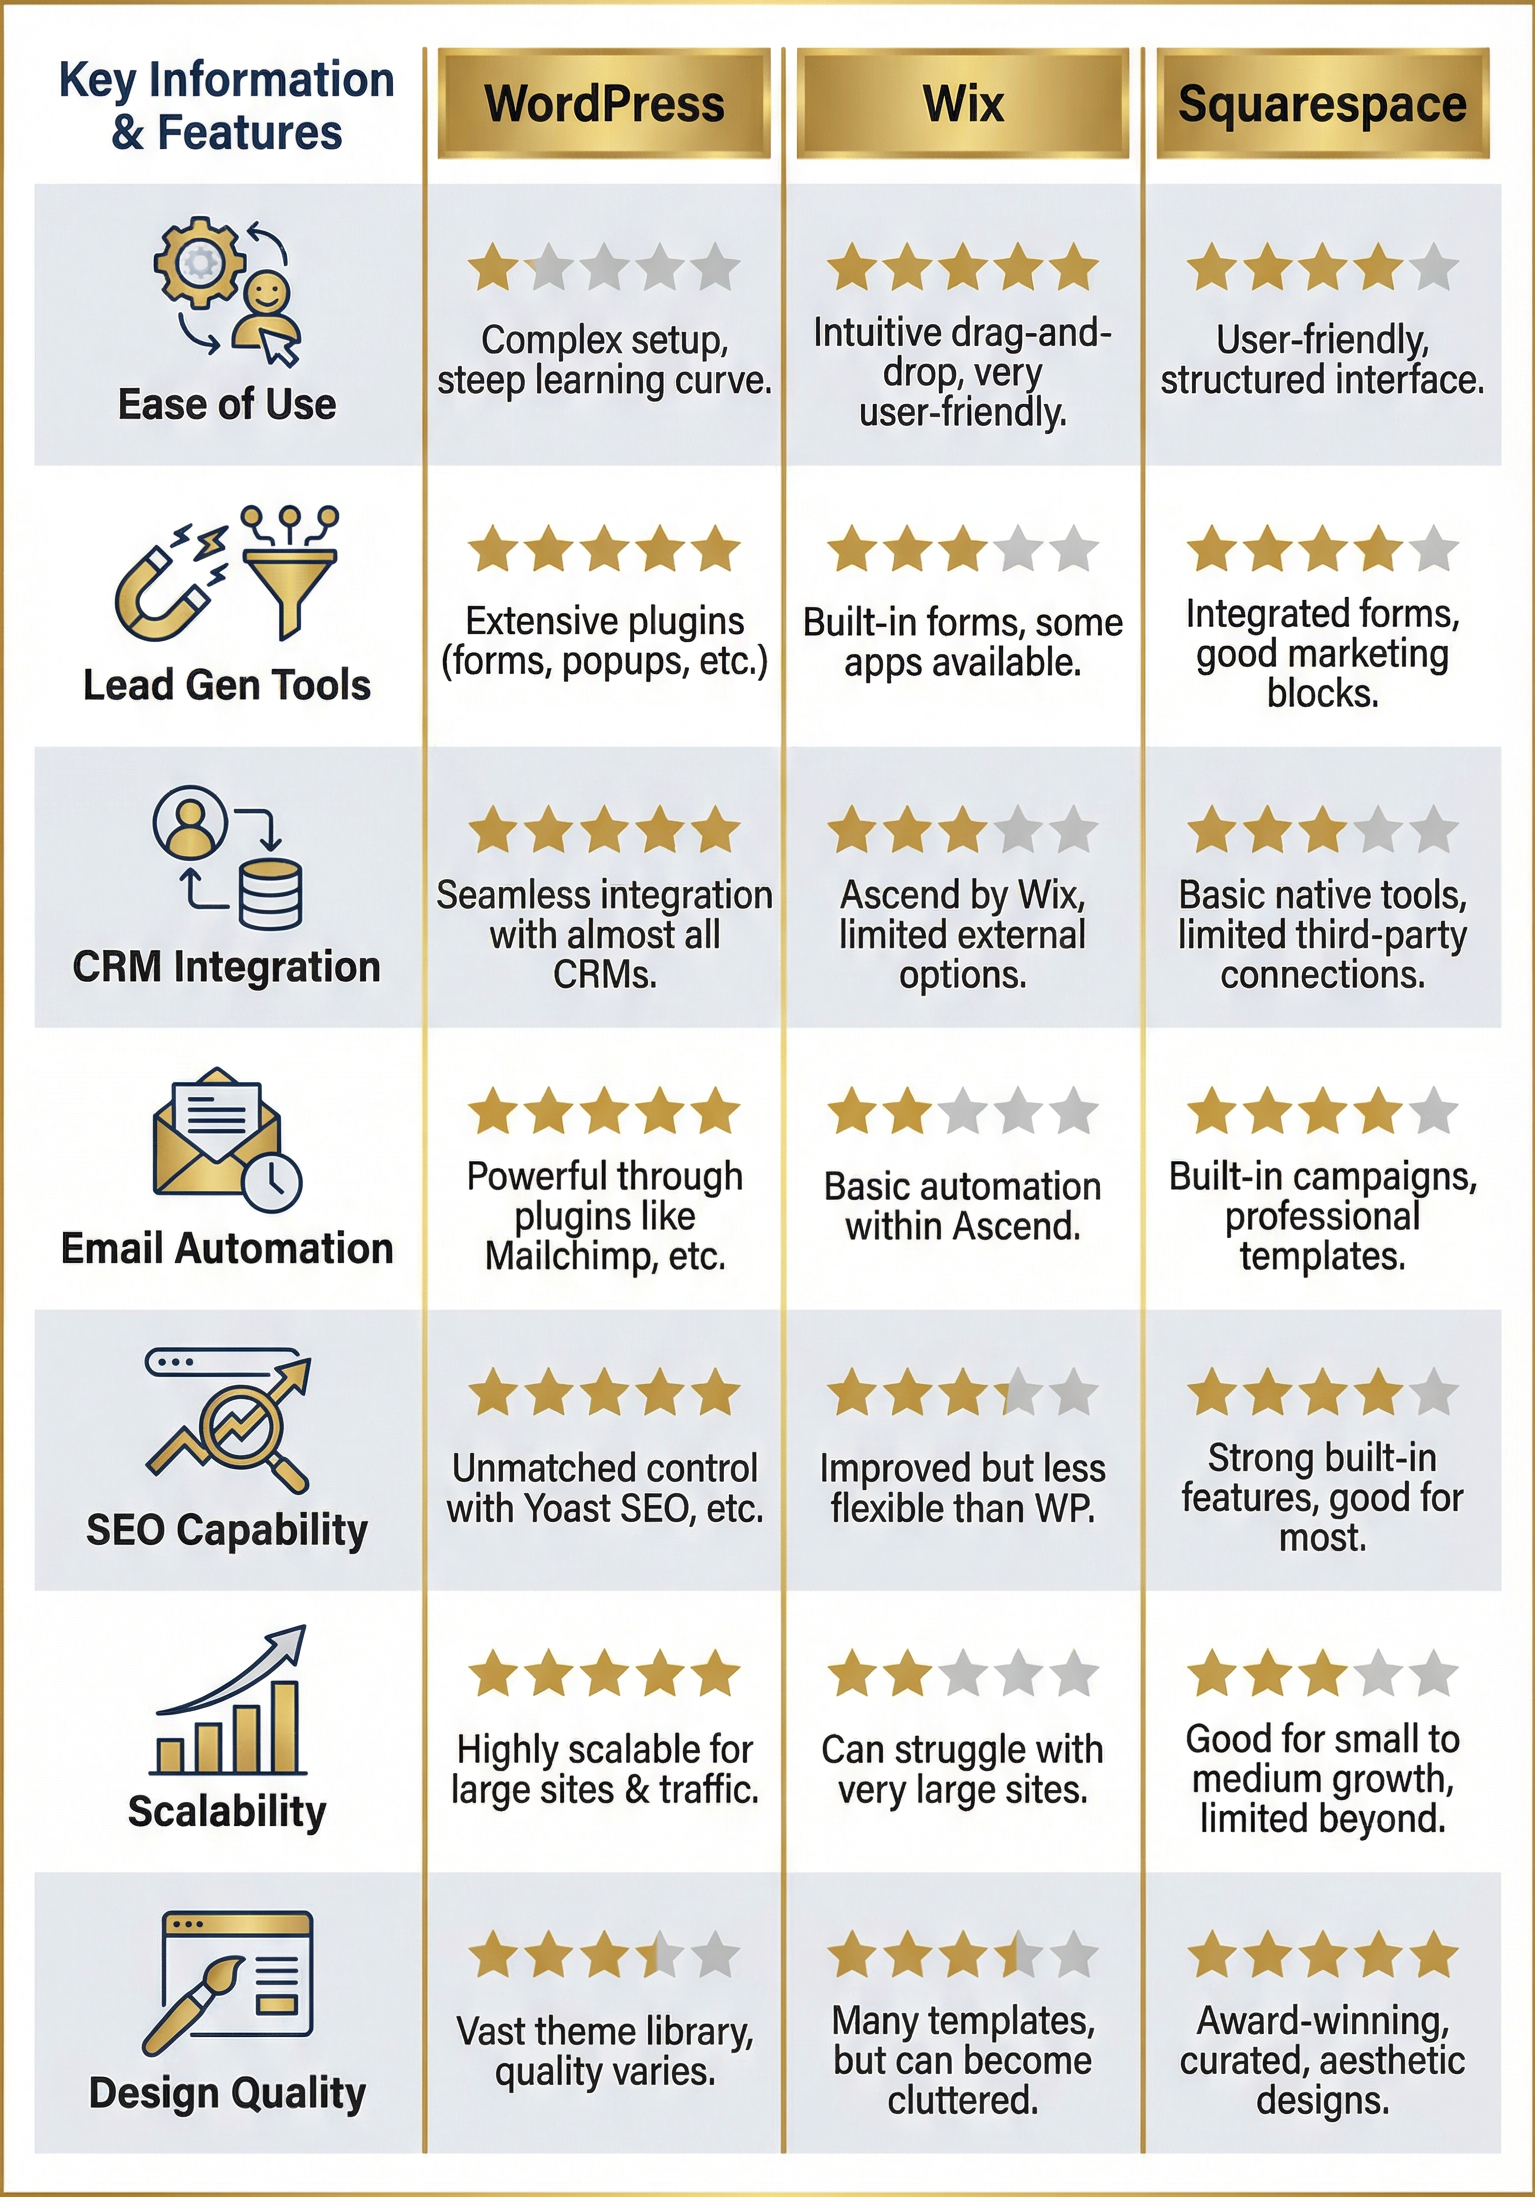
Fix #2: Enable Caching
- WordPress: Install WP Rocket
- Wix/Squarespace: Built-in (just enable)
- Typical improvement: 1-2 seconds
Fix #3: Remove Unused Plugins/Apps
- Audit what’s actually being used
- Delete the rest
- Typical improvement: 0.5-1 second
Fix #4: Use a CDN
- Cloudflare has a free tier
- Distributes content globally
- Typical improvement: 0.5-1.5 seconds
One consultant’s results:
Before optimization: 7.2 seconds, 1.4% conversion
After optimization: 2.3 seconds, 5.8% conversion
Time investment: 3 hours
Result: 4.1x improvement
Finding #7: Email Nurture Sequences Multiplied Results
What I Found
Bottom 85%:
- 82% had no email automation at all
- 18% had generic weekly newsletter
- Average download-to-consultation rate: 8%
Top 15%:
- 100% had automated nurture sequences
- Average sequence length: 7-9 emails over 21-30 days
- Average download-to-consultation rate: 34%
The Math
Without email automation:
- 200 visitors → 12 downloads → 1 consultation (8% of downloads)
- Total: 1 consultation
With email automation:
- 200 visitors → 12 downloads → 4 consultations (34% of downloads)
- Total: 4 consultations
4x more consultations from the same downloads.
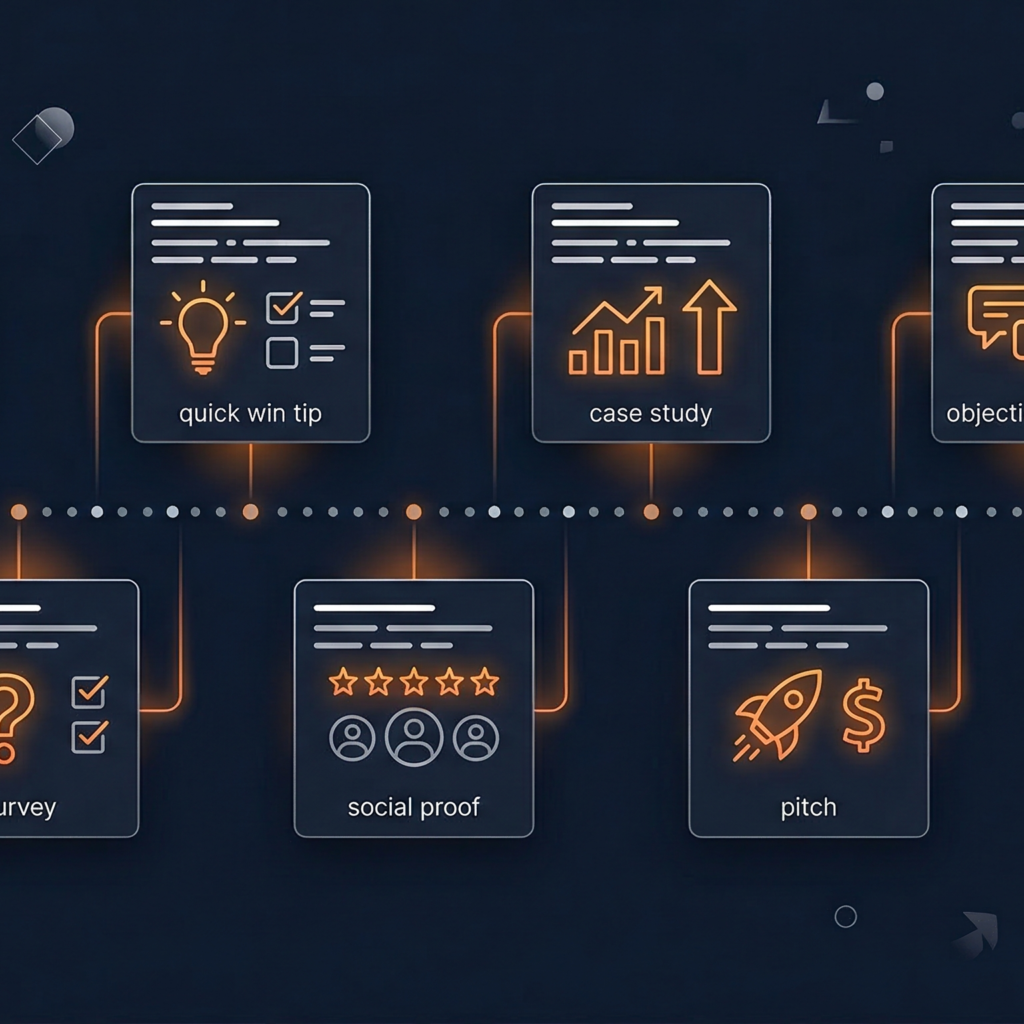
What the Top Sequences Looked Like
Day 0: Deliver resource immediately
Day 2: Quick win tip related to resource
Day 5: Case study showing desired outcome
Day 8: Address #1 objection (usually cost or time)
Day 12: Survey about their current situation
Day 16: Social proof (3-4 detailed testimonials)
Day 21: Clear pitch with 3 options
Day 28: Re-engagement or final attempt
One Winning Email (Day 5)
Subject: “How Michael went from 4 leads/month to 18”
Body: “Quick question: How many consultation requests do you get from your website each month?
Michael (strategy consultant for SaaS companies) was getting 4.
Not enough to sustain growth. He was spending $2K/month on LinkedIn ads just to get leads.
We rebuilt his website with the framework from the guide you downloaded. Here’s what changed:
- Added a qualification quiz (captured 3x more leads)
- Created a 7-email nurture sequence (converted 38% of downloads)
- Integrated his CRM (nothing fell through cracks)
90 days later: 18 consultation requests per month. Zero ad spend.
His revenue from the website: $4,800/month → $21,600/month.
Want to see the exact framework he used? Reply to this email and I’ll send you the case study PDF.
— Your Name”
Results from this single email:
- Open rate: 47%
- Reply rate: 12%
- Consultation bookings: 18% of opens
The Top Performer Blueprint: What They All Had in Common
Every high-converting site (7.5%+) shared these elements:
1. Crystal-Clear Value Proposition
Test: Can a stranger understand what you do in 5 seconds?
Formula: [Who you serve] + [What outcome] + [How/Timeframe]
2. Multiple Conversion Paths
Minimum three options:
- Low commitment (lead magnet)
- Medium commitment (case study/video)
- High commitment (consultation)
3. Fast Response Time
Under 4 hours, ideally under 1 hour.
System: CRM integration + phone notification + commitment to respond
4. Specific Social Proof
Numbers, names (with permission), and outcomes.
Placement: Homepage above fold, services page, booking page
5. Fast Load Speed
Under 3 seconds on mobile.
Fix: Compress images, enable caching, use CDN
6. Specific CTAs
Not “Contact Us” → “Book Your Free 15-Minute Strategy Call”
7. Automated Email Nurture
7-9 emails over 21-30 days converting 30-40% of downloads
Your Conversion Audit: Score Your Website
Rate each element 1-5 (5 = excellent, 1 = needs work):
Value Proposition:
- [ ] Stranger understands in 5 seconds: ___/5
- [ ] Specific about who you serve: ___/5
- [ ] Clear about outcome: ___/5
Conversion Paths:
- [ ] Have 3+ conversion options: ___/5
- [ ] Lead magnet for browsers: ___/5
- [ ] Direct booking option: ___/5
Response Time:
- [ ] Respond within 4 hours: ___/5
- [ ] Have notification system: ___/5
- [ ] Never miss inquiries: ___/5
Social Proof:
- [ ] Testimonials above fold: ___/5
- [ ] Include specific numbers: ___/5
- [ ] 5+ testimonials visible: ___/5
Technical:
- [ ] Site loads under 3 seconds: ___/5
- [ ] Mobile-optimized: ___/5
- [ ] No broken links: ___/5
CTAs:
- [ ] Specific, not generic: ___/5
- [ ] Clear what happens next: ___/5
- [ ] Low friction: ___/5
Email Automation:
- [ ] Have nurture sequence: ___/5
- [ ] 7+ emails: ___/5
- [ ] Provides value first: ___/5
Total Score: ___/105
90-105: Top 10% – Small optimizations only
75-89: Above average – Few quick wins available
60-74: Average – 5-10 improvements needed
45-59: Below average – Major overhaul recommended
Under 45: Bottom 15% – Start from scratch
The 30-Day Transformation Plan
Don’t try to fix everything at once. Focus on highest-impact changes first.
Week 1: Foundation
Day 1-2: Rewrite headline
- Use the [specific audience] + [specific outcome] formula
- Test with 5 people (5-second test)
Day 3-4: Add lead magnet
- Create one valuable resource
- Add prominent CTA on homepage
- Set up delivery
Day 5-7: Fix load speed
- Compress all images
- Enable caching
- Run PageSpeed test
Week 2: Social Proof
Day 8-10: Request testimonials
- Email 5 best clients
- Ask for specific numbers
- Offer to draft for them
Day 11-14: Place testimonials
- Homepage (one above fold)
- Services page (three throughout)
- Booking page (one final)
Week 3: Automation
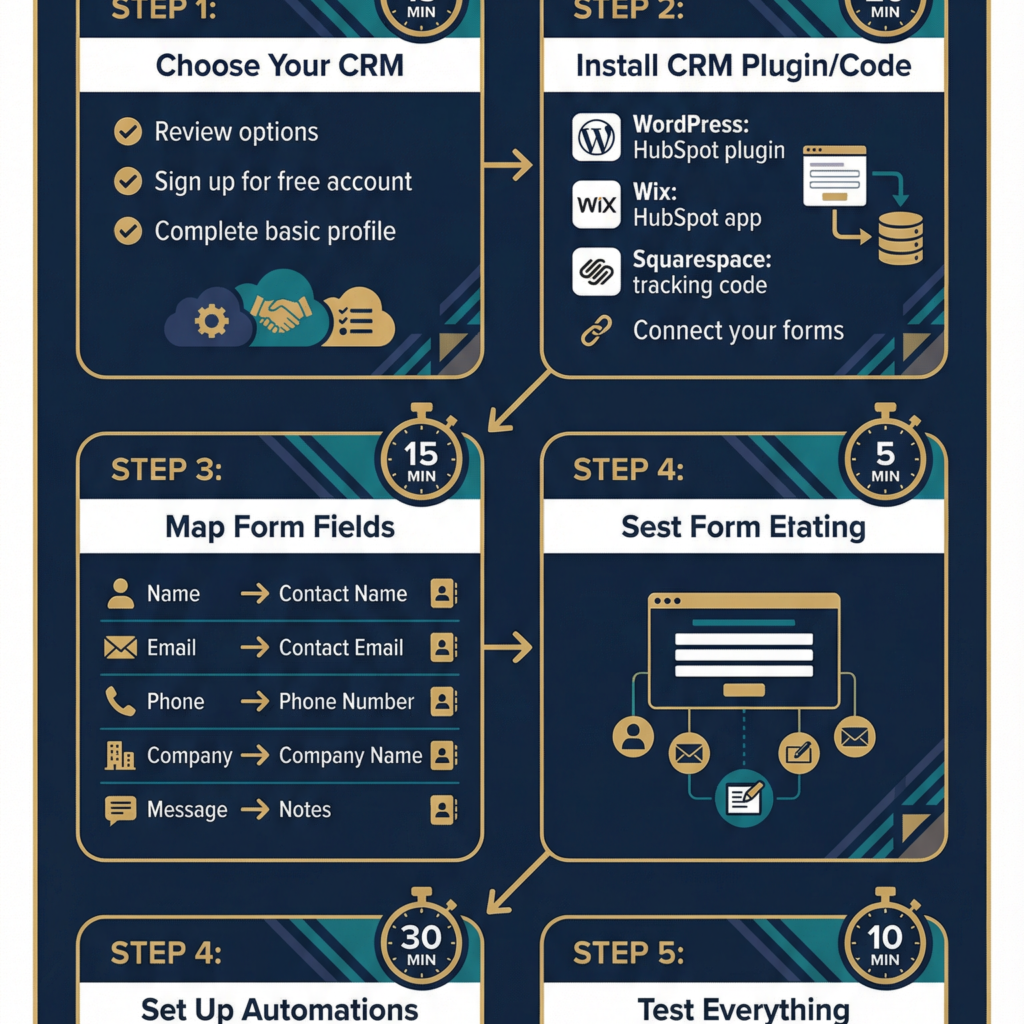
Day 15-17: Set up CRM
- Choose platform (HubSpot free tier works)
- Connect forms
- Test with dummy submission
Day 18-21: Write email sequence
- 7 emails over 21 days
- Focus on value first, pitch last
- Set up automation
Week 4: Optimize & Test
Day 22-24: Improve CTAs
- Replace “Contact Us” with specific CTAs
- A/B test button text
- Track click rates
Day 25-28: Response system
- Set up instant notifications
- Commit to 4-hour response time
- Create response templates
Day 29-30: Measure & Document
- Run full audit
- Document conversion rate
- Set goals for next month
Real Results: What Happens When You Implement This
Before & After: Three Consultants
Consultant A (Executive Coach):
Before: 1.8% conversion rate
Changes: New headline, lead magnet, testimonials above fold
After: 6.4% conversion rate (30 days later)
Result: 3.6x improvement
Consultant B (Strategy Consultant):
Before: 1.2% conversion rate
Changes: Email automation, faster response, CRM integration
After: 8.1% conversion rate (45 days later)
Result: 6.8x improvement
Consultant C (Leadership Advisor):
Before: 2.1% conversion rate
Changes: All 7 elements from findings above
After: 11.3% conversion rate (60 days later)
Result: 5.4x improvement
The Common Pattern
None needed more traffic. All focused on better conversion.
Average improvement: 4-6x more leads from the same traffic.
The Bottom Line
After analyzing 47 consultant websites, the pattern is clear:
Top performers (15%) don’t get more traffic. They convert better.
They do 7 specific things differently:
- Multiple conversion paths
- Fast response times
- Crystal-clear value proposition
- Strategic social proof placement
- Fast load speeds
- Specific CTAs
- Automated email nurture
None of these require design skills. None require huge budgets. All are implementable in 30 days.
The question isn’t whether your consultant website conversion rate can improve. The data proves it can.
The question is: Will you actually implement these 7 changes?
Need Help Implementing These Findings?
We’ve helped 50+ consultants implement these exact changes. Here’s what we include:
Conversion Audit Package ($500):
- Complete website analysis
- Conversion rate benchmark
- Specific recommendations
- Priority implementation order
Full Implementation ($3,500-6,500):
- New value proposition
- Lead magnet creation
- Email automation setup
- CRM integration
- Speed optimization
- Social proof placement
- 30-day optimization
Timeline: 3-4 weeks
Result: 3-5x improvement in leads
Book a free 15-minute audit call. We’ll review your site, identify the top 3 issues costing you leads, and show you what fixing them would mean for your business.
Book Your Free Website Audit →
Or download our conversion rate calculator to see exactly how many additional clients a 3-5x improvement would mean for your revenue.
Download Free Conversion Calculator →
What’s your current consultant website conversion rate? Drop a comment with your numbers and I’ll personally analyze what’s holding you back.